 |
|
 |
 In 2008-09 earnings and profits tax collections attained a new high of $146.1 billion. The growth, recorded at $12.4 billion or 9.3%, was brought about by the expanding economy in the previous year of assessment. However, with the global financial crisis in the year, the stock market and property market contracted sharply. Stamp duty collections went down to $32.2 billion, representing a decrease of $19.4 billion or 37.6%. Overall, the total revenue collected by IRD in the year was $191.5 billion, dropped by $9.2 billion or 4.6% from the previous year (Figure 1, Schedules 1 and 2). In 2008-09 earnings and profits tax collections attained a new high of $146.1 billion. The growth, recorded at $12.4 billion or 9.3%, was brought about by the expanding economy in the previous year of assessment. However, with the global financial crisis in the year, the stock market and property market contracted sharply. Stamp duty collections went down to $32.2 billion, representing a decrease of $19.4 billion or 37.6%. Overall, the total revenue collected by IRD in the year was $191.5 billion, dropped by $9.2 billion or 4.6% from the previous year (Figure 1, Schedules 1 and 2).
Figure 1 Revenue collected by tax type
| |
Type of tax |
2005-06
($m) |
|
2006-07
($m) |
|
2007-08
($m) |
|
2008-09
($m) |
|
| |
Profits tax – |
|
|
|
|
|
|
|
|
| |
 |
Corporations |
|
65,586.1 |
|
65,499.6 |
|
86,775.6 |
|
99,294.4 |
|
| |
 |
Unincorporated businesses |
|
4,210.4 |
|
6,419.4 |
|
4,647.1 |
|
4,857.1 |
|
| |
Salaries tax |
37,493.9 |
|
38,585.6 |
|
37,479.5 |
|
39,007.9 |
|
| |
Property tax |
1,267.1 |
|
1,247.4 |
|
1,240.6 |
|
832.5 |
|
| |
Personal assessment |
3,193.9 |
|
3,565.6 |
|
3,586.6 |
|
2,151.1 |
|
| |
Total earnings & profits tax |
111,751.4 |
|
115,317.6 |
|
133,729.4 |
|
146,143.0 |
|
| |
Estate duty |
1,675.7 |
|
777.7 |
|
353.4 |
|
176.0 |
|
| |
Stamp duty |
17,867.2 |
|
25,076.6 |
|
51,549.1 |
|
32,162.1 |
|
| |
Betting duty |
11,938.1 |
|
12,047.4 |
|
13,048.4 |
|
12,620.3 |
|
| |
Business registration fees |
1,478.8 |
|
1,497.9 |
|
1,565.8 |
|
154.4 |
|
| |
Hotel accommodation tax (Tax rate reduced to 0% from 1 July 2008) |
310.0 |
|
384.2 |
|
450.4 |
|
222.9 |
|
| |
Total revenue collected |
|
|
|
|
|
|
|
|
| |
% change over previous year |
13.6% |
|
7.0% |
|
29.4% |
|
-4.6% |
|
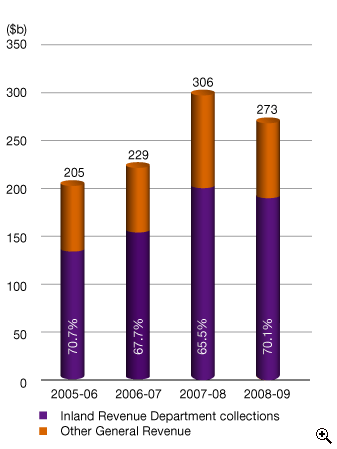
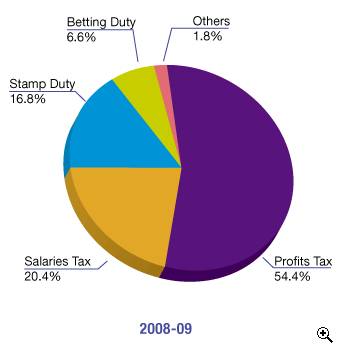
The revenue collected by the Department during 2008-09 accounted for 70.1% of the Government General Revenue (Figure 2). Profits tax contributed the largest part of the total revenue collected, followed by salaries tax. Together they made up 74.8% of the total revenue collected (Figure 3).
Figure 2 Government General Revenue

Figure 3 Composition of the revenue collection

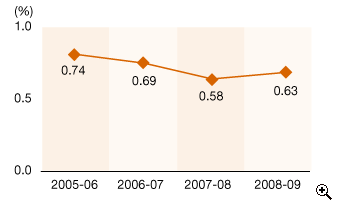
With a drop in revenue collections during the year, the cost of collection of revenue increased from 0.58% to 0.63% (Figure 4).
Figure 4 Cost of collection

|
|
|