|
|
|
| |
| |
| Revenue |
| |
| |
Our economy recovered throughout 2004. This, coupled with the implementation of phase II tax increase measures introduced in the 2003-04 Budget, has boosted our Earnings and Profits Tax collection to a record high. There was an increase of $16.2 billion in Earnings and Profits Tax collections, representing a growth of 20.2% as compared with the previous year (Figure 1, Schedules 1 and 2 ) . The booming property and stock markets in the year also brought about a substantial increase of $4.6 billion in stamp duty collections.
|
| |
 |
| |
| |
2001-02 |
2002-03 |
2003-04 |
2004-05 |
| Type of tax |
($m) |
($m) |
($m) |
($m) |
| Profits Tax- |
| Corporations |
39,272.4 |
33,692.9 |
43,666.3 |
52,562.2 |
| Unincorporated Businesses |
5,103.3 |
5,106.6 |
5,103.7 |
6,077.5 |
| Salaries Tax |
28,634.6 |
29,733.1 |
27,976.9 |
33,990.5 |
| Property Tax |
1,135.7 |
1,180.1 |
983.0 |
1,115.6 |
| Personal Assessment |
3,603.0 |
3,315.9 |
2,744.4 |
2,963.4 |
| Total Earnings & Profits Tax |
77,749.0 |
73,028.6 |
80,474.3 |
96,709.2 |
| Estate Duty |
1,927.8 |
1,402.7 |
1,455.3 |
1,468.4 |
| Stamp Duty |
8,636.6 |
7,458.2 |
11,245.4 |
15,851.4 |
| Betting Duty |
11,571.3 |
10,920.7 |
11,635.9 |
12,057.2 |
| Business Registration Fees |
1,240.2 |
127.7 |
1,233.3 |
1,348.7 |
| Hotel Accommodation Tax |
202.9 |
201.0 |
155.6 |
247.4 |
| Total revenue collected |
101,327.8
 |
93,138.9
|
106,199.8
|
127,682.3
|
| % change over previous year |
0.9% |
-8.1% |
14.0% |
20.2% |
|
| |
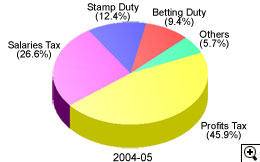
Overall, revenue collected by the Department during 2004-05 totalled $127.7 billion (about 60% of the Government General Revenue, see Figure 2 ). This represents an increase of $21.5 billion or 20.2%, from that collected in the previous year. The major part of the revenue collected came from Profits Tax and Salaries Tax, which together contributed 72.5% (Figure 3) . |
| |
|
|
Total Government General Revenue
|
| |
* including a transfer of $120 billion from the Land Fund |
|
|
|
|
|
|
|
| |
With material productivity savings and an increase in revenue collections during the year, the cost of collection of revenue decreased from 1.14% to 0.86% (Figure 4) .
|
|
| |
|
| |
| |
|
|
|
|